Variability in Africa
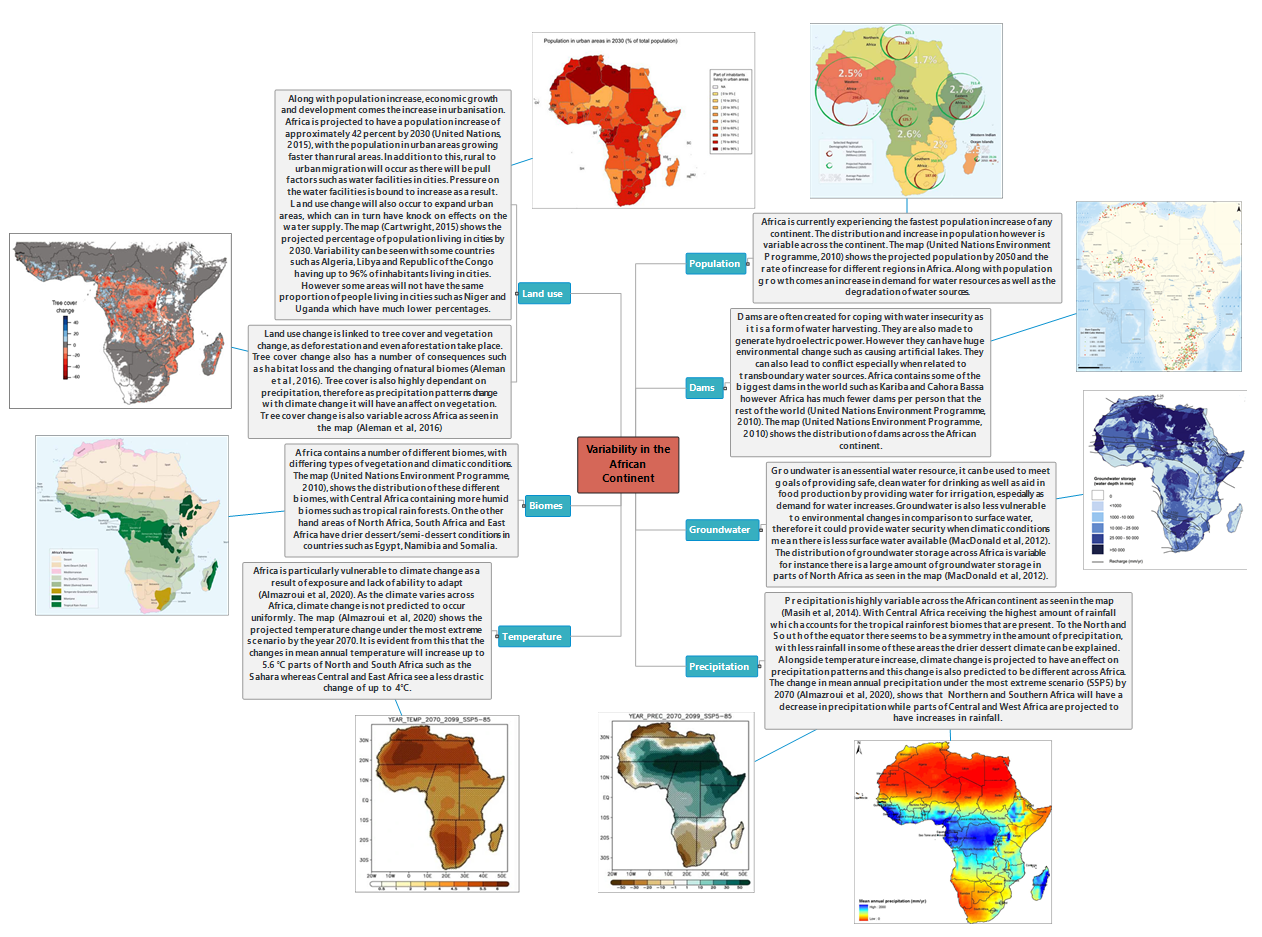
As mentioned in my introductory post, there are differing human and environmental conditions across the continent of Africa. The variability of these conditions often influence or are influenced by water presence. I thought it would be interesting to get a better picture of the variability within Africa so I created a visual mind map:
 | |
|
For me, this mind map is a great way to picture how varied the continent is and also reminds me of how much needs to be considered when discussing environmental change and water in Africa. I also noticed how interconnected each branch is, for instance the presence of a particular biome is influenced by precipitation and water availability which in turn can be influenced by physical location.
I aim to use this post as a basis for my blog by expanding on certain branches and perhaps seeing how they are related to each other. I would love to know if there is anything else you would add to this mind map, or even an area mentioned that you would like to hear about most, so please do leave a comment below.


Really great idea to create your own diagram to show variability in Africa. Could you make the embedded image larger so that the reader can see the information a bit more easily? I think you could enhance your post by adding a little bit of a summary (or highlights) of what you found regarding the variability, including a short concluding sentence or two about what it means for water and environmental change in Africa.
ReplyDeletePerhaps consider increasing the font you use in your posts? It will enhance the readability of your posts.
(GEOG0036 PGTA)
I look forward to reading more! Perhaps you could focus on one of the issues in your diagram in your next post. You have certainly done a lot of research on it and you could delve into (one or more) of these issues greater depth if you wanted to.
ReplyDeleteThank you! I aimed to use this diagram as a basis to help me structure and add further detail to these topics in the rest of my blog. My next few posts go into more detail, such as those that focus on precipitation, I hope you enjoy reading them.
DeleteThis comment has been removed by the author.
ReplyDeleteI love the idea of visually representing information! It makes understanding the variability across the continent of Africa easy to understand and remember. You have clearly spent a lot of time researching and condensing this information.
ReplyDeleteI really appreciate your comment, thank you! I feel like actually seeing and reading about a topic at the same time gives me a better understanding of it, so that is why I wanted to do the same for this post :)
Delete